As economies reopened following the pandemic, both profit shares and inflation spiked, prompting the use of terms such as ‘profit-led inflation’ to describe this phenomenon. Weber and Wasner (2023) argue that a large share of post-pandemic inflation is due to the ability of firms with market power to excessively hike prices, with the large post-pandemic pent-up demand and the ensuing supply bottleneck crunch serving as a coordinating device for firms to simultaneously increase prices. Other studies have used aggregate data from national accounts to quantify this role of profits in explaining the current inflationary episode, finding that they contributed to some extent to the US and euro area post-pandemic inflation (Arce et al. 2023, Glover et al. 2023). For the UK, Manuel et al. (2023) document similar results, especially for 2021, using their newly constructed measure of excess corporate profits share.
However, profit shares calculated from national accounts data provide an imperfect measure of firms’ pricing strategies as they do not account for intermediate input costs. Colonna et al. (2023) note that since the profit share is calculated as profits relative to value added, it might increase even if markups remain constant. This is because value added excludes intermediate inputs and when the (relative) price of the latter increases – as it occurred during 2021-22 – the overall value added may grow less than total revenue. As a result, the measured profit share might increase even if the pricing strategies of firms are unchanged.
Price markup measures derived from firm-level data better reflects firms’ pricing behaviour. Following the methodology of De Loecker et al. (2020), we express the markup of a firm as the ratio of sales to total costs, interacted with a measure of output elasticity to firms’ inputs of production.
This method suffers less from measurement issues discussed above and allows us to recover a distribution of markups at the firm level before aggregating them into an overall economy-wide markup using different weighting schemes.
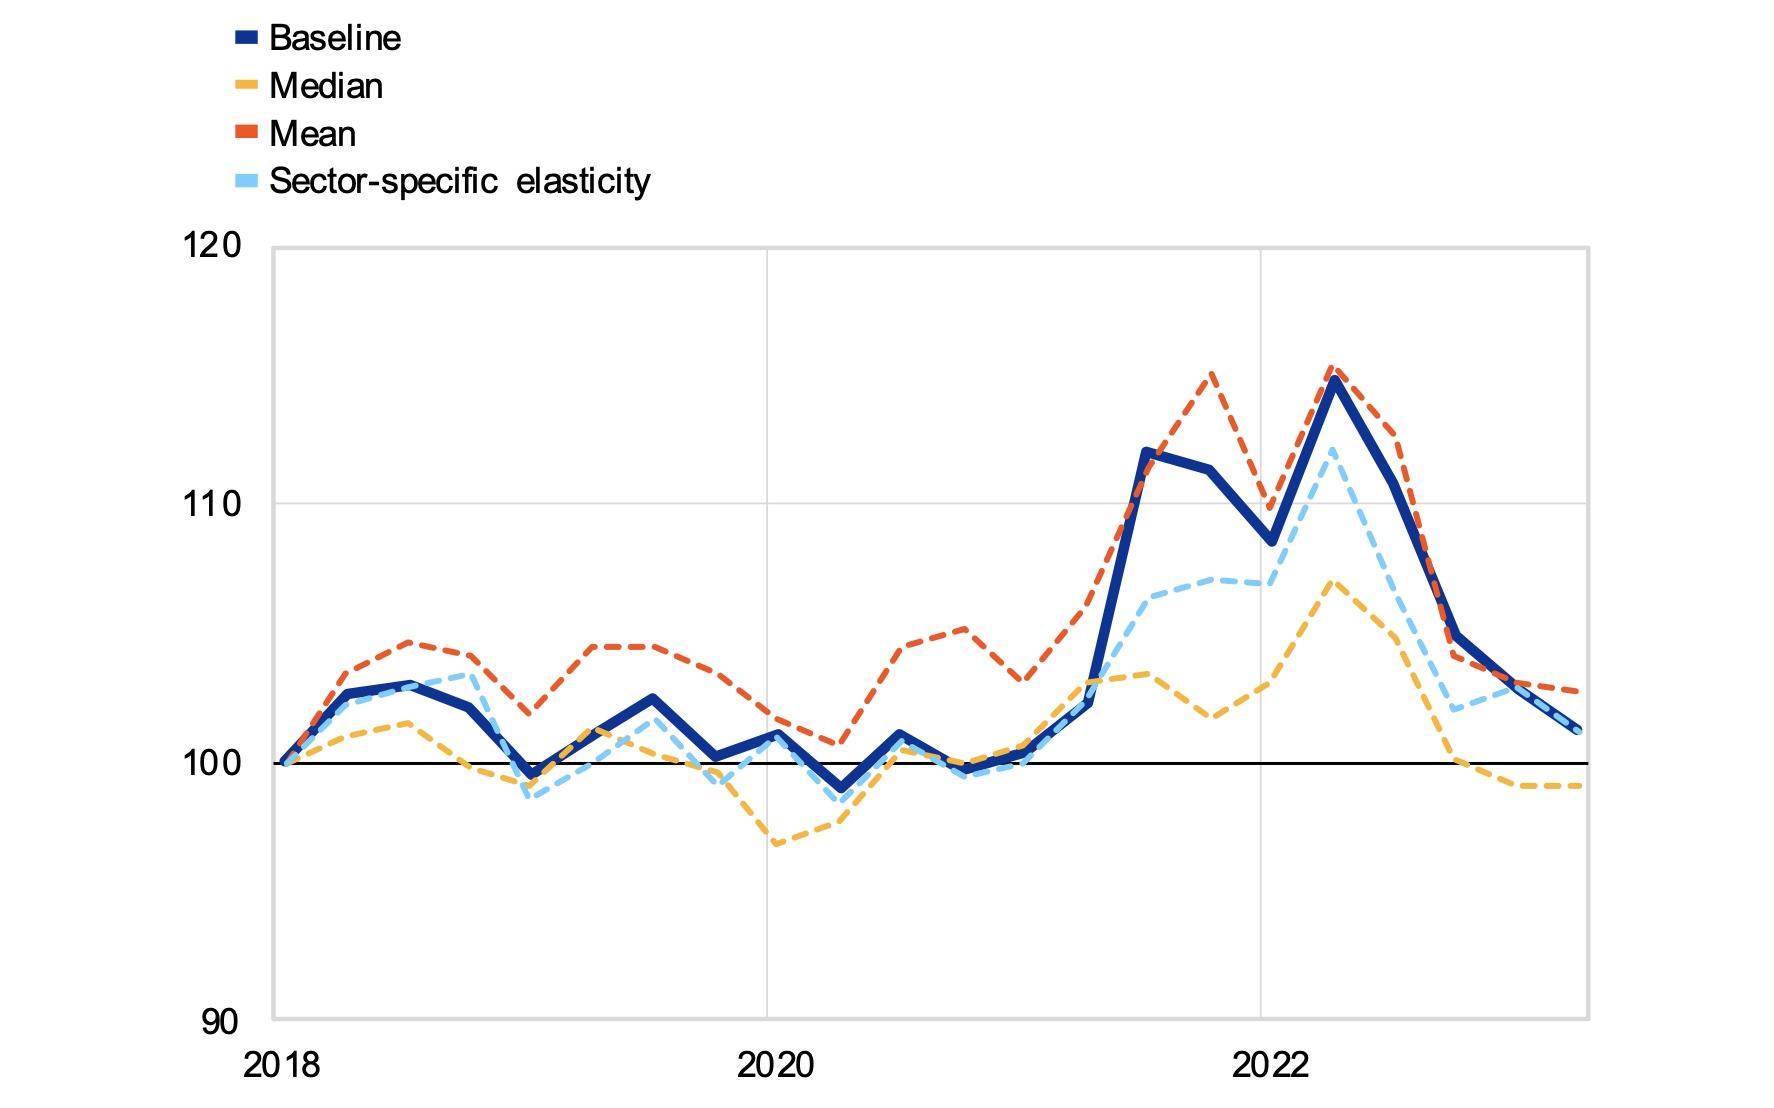
The data show that, in aggregate, the increase in US markup was temporary and, since mid-2022, it has been receding towards pre-pandemic levels. The economy-wide markup increased following the re-opening of the economy in 2021, reaching a peak in 2022 Q2 at around 15% above pre-pandemic levels. Since then, the markup has been receding towards pre-pandemic levels.
As shown in Figure 1, this increase in the markup is robust to alternative aggregation methods, all pointing to a rise in the markup during the post-pandemic rebound and a decline thereafter.
Figure 1 Aggregate price markups (indices; 2018 Q1 = 100)
Sources: Refinitiv Financials and authors’ calculations.
Notes: Price markups are calculated from firm-level data using a constant output elasticity to inputs of production, taken from the production function approach estimated by De Loecker et al. (2020). The aggregate markup (baseline) is calculated as a weighted average of firm-level markups using time-varying weights, given by the sales ratio of each firm with respect to the total sales among all firms. The sector-specific elasticity markup uses, instead of a constant output elasticity, sectoral output elasticity as estimated by De Loecker et al. (2020). The aggregate markup is then computed as a weighted average based on total revenue shares. Latest observation: 2023 Q2.
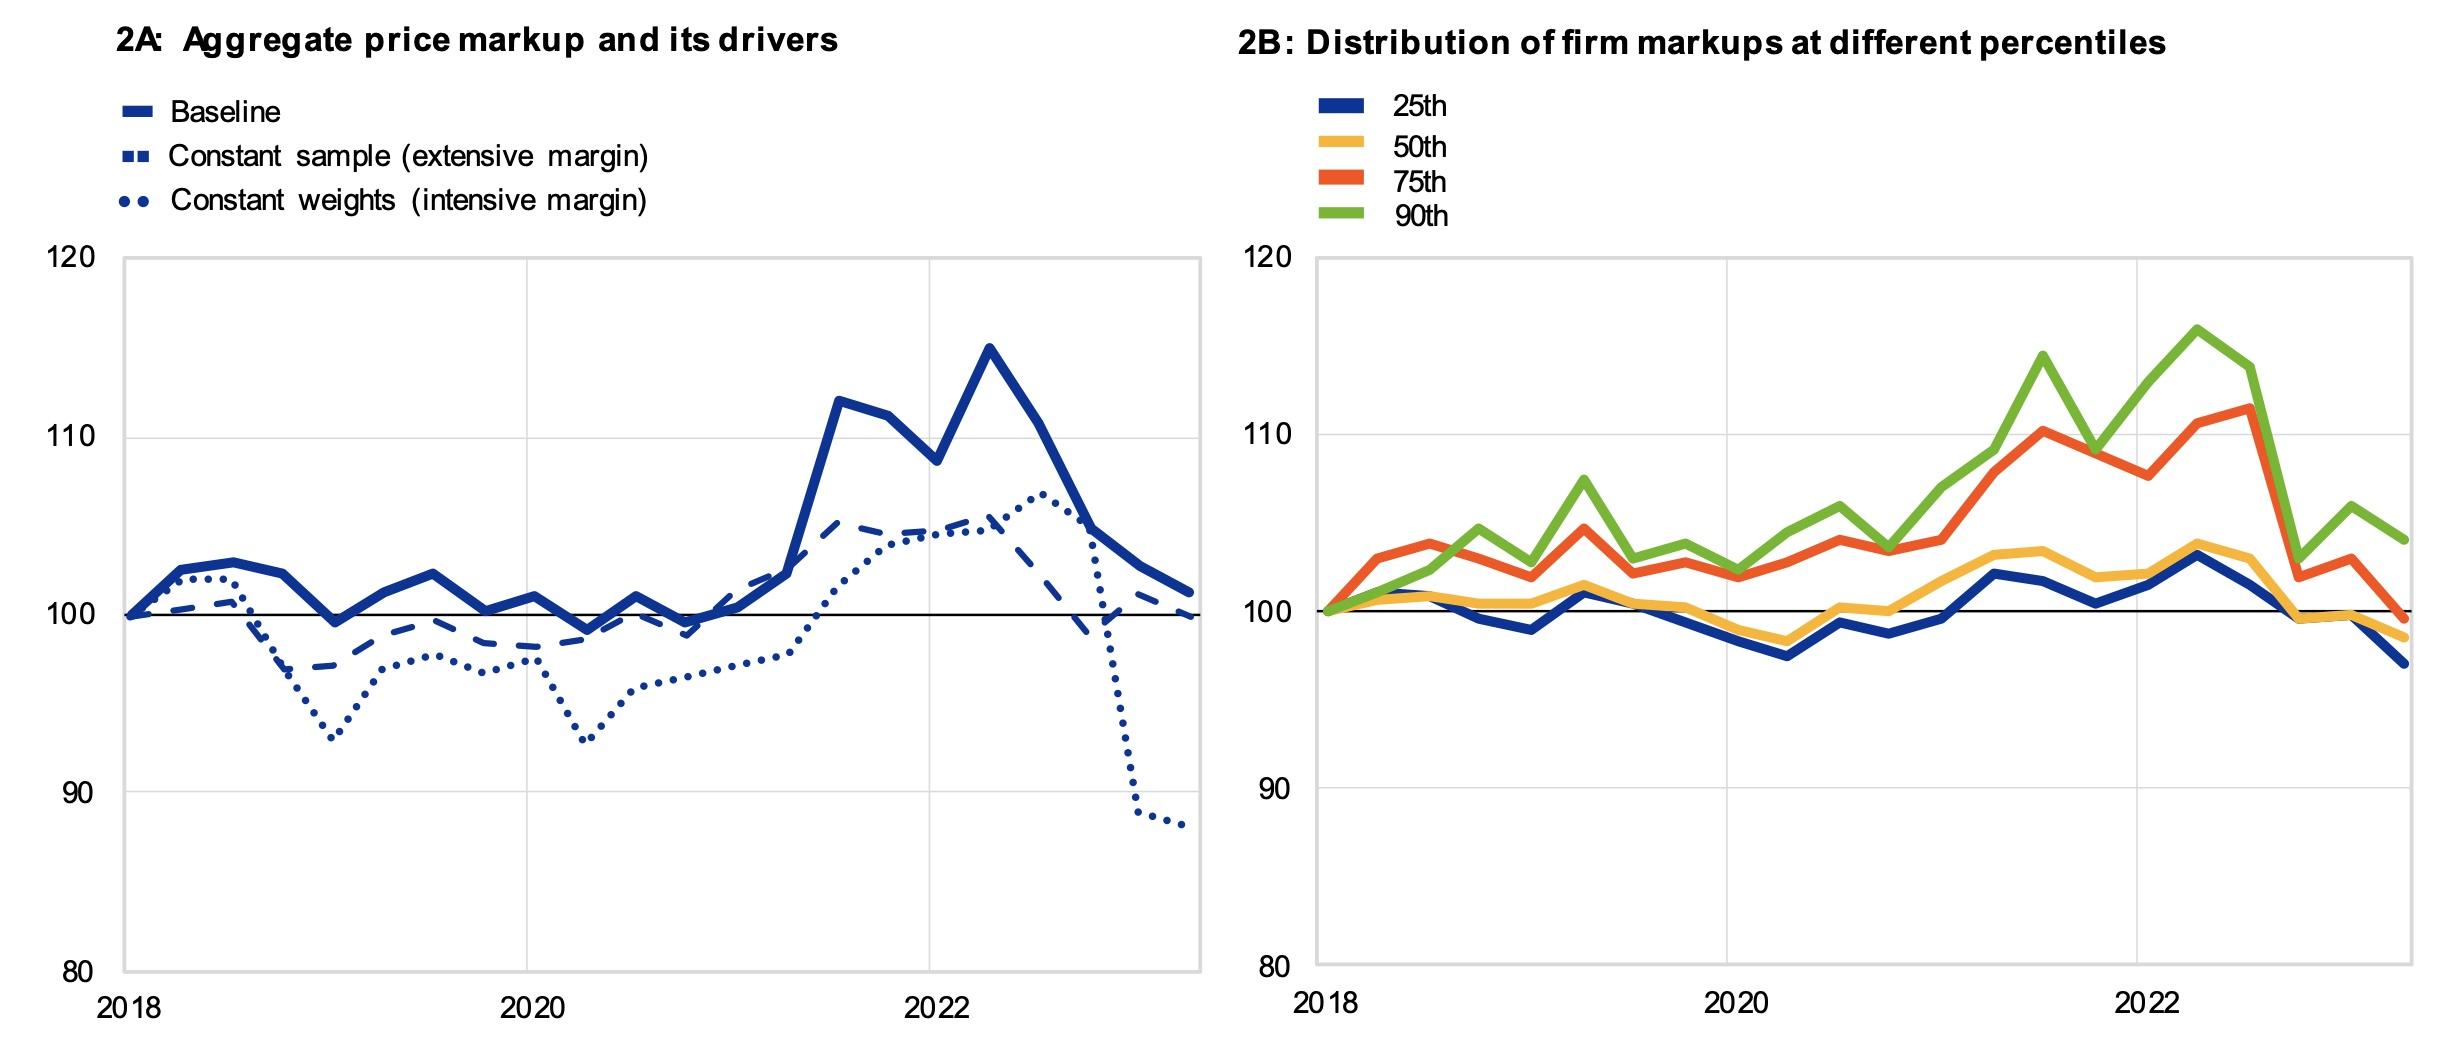
The rise in markups resulted from a change in both the intensive and the extensive margin and appears mostly driven by a subset of high-markup firms. The economy-wide markup can increase not only because of a genuine increase in firm level markups over time (intensive margin), but also because of re-allocation of market shares towards high markup firms and/or by the entry and exit of firms in the sample (extensive margin). Figure 2A provides insights into the relative importance of the intensive and the extensive margin. Using a constant sample over time (not allowing the exit and entry of firms) and constant weights when calculating the weighted average (not allowing a reallocation of customers/sales across firms), shows that the increase in the markup resulted from a change in both the intensive and extensive margin. Moreover, most of this increase is attributed to the dynamics of high markup firms, particularly those firms that have a markup above the 75th percentile in the distribution of all firms (Figure 2B).
Figure 2 Drivers of changes in price markups (indices; 2018 Q1 = 100)
Sources: Refinitiv Financials and authors’ calculations.
Notes: For the right-hand side panel, firm-level markups have been ordered from the lowest to highest in each quarter and then percentiles are calculated. Latest observation: 2023 Q2.
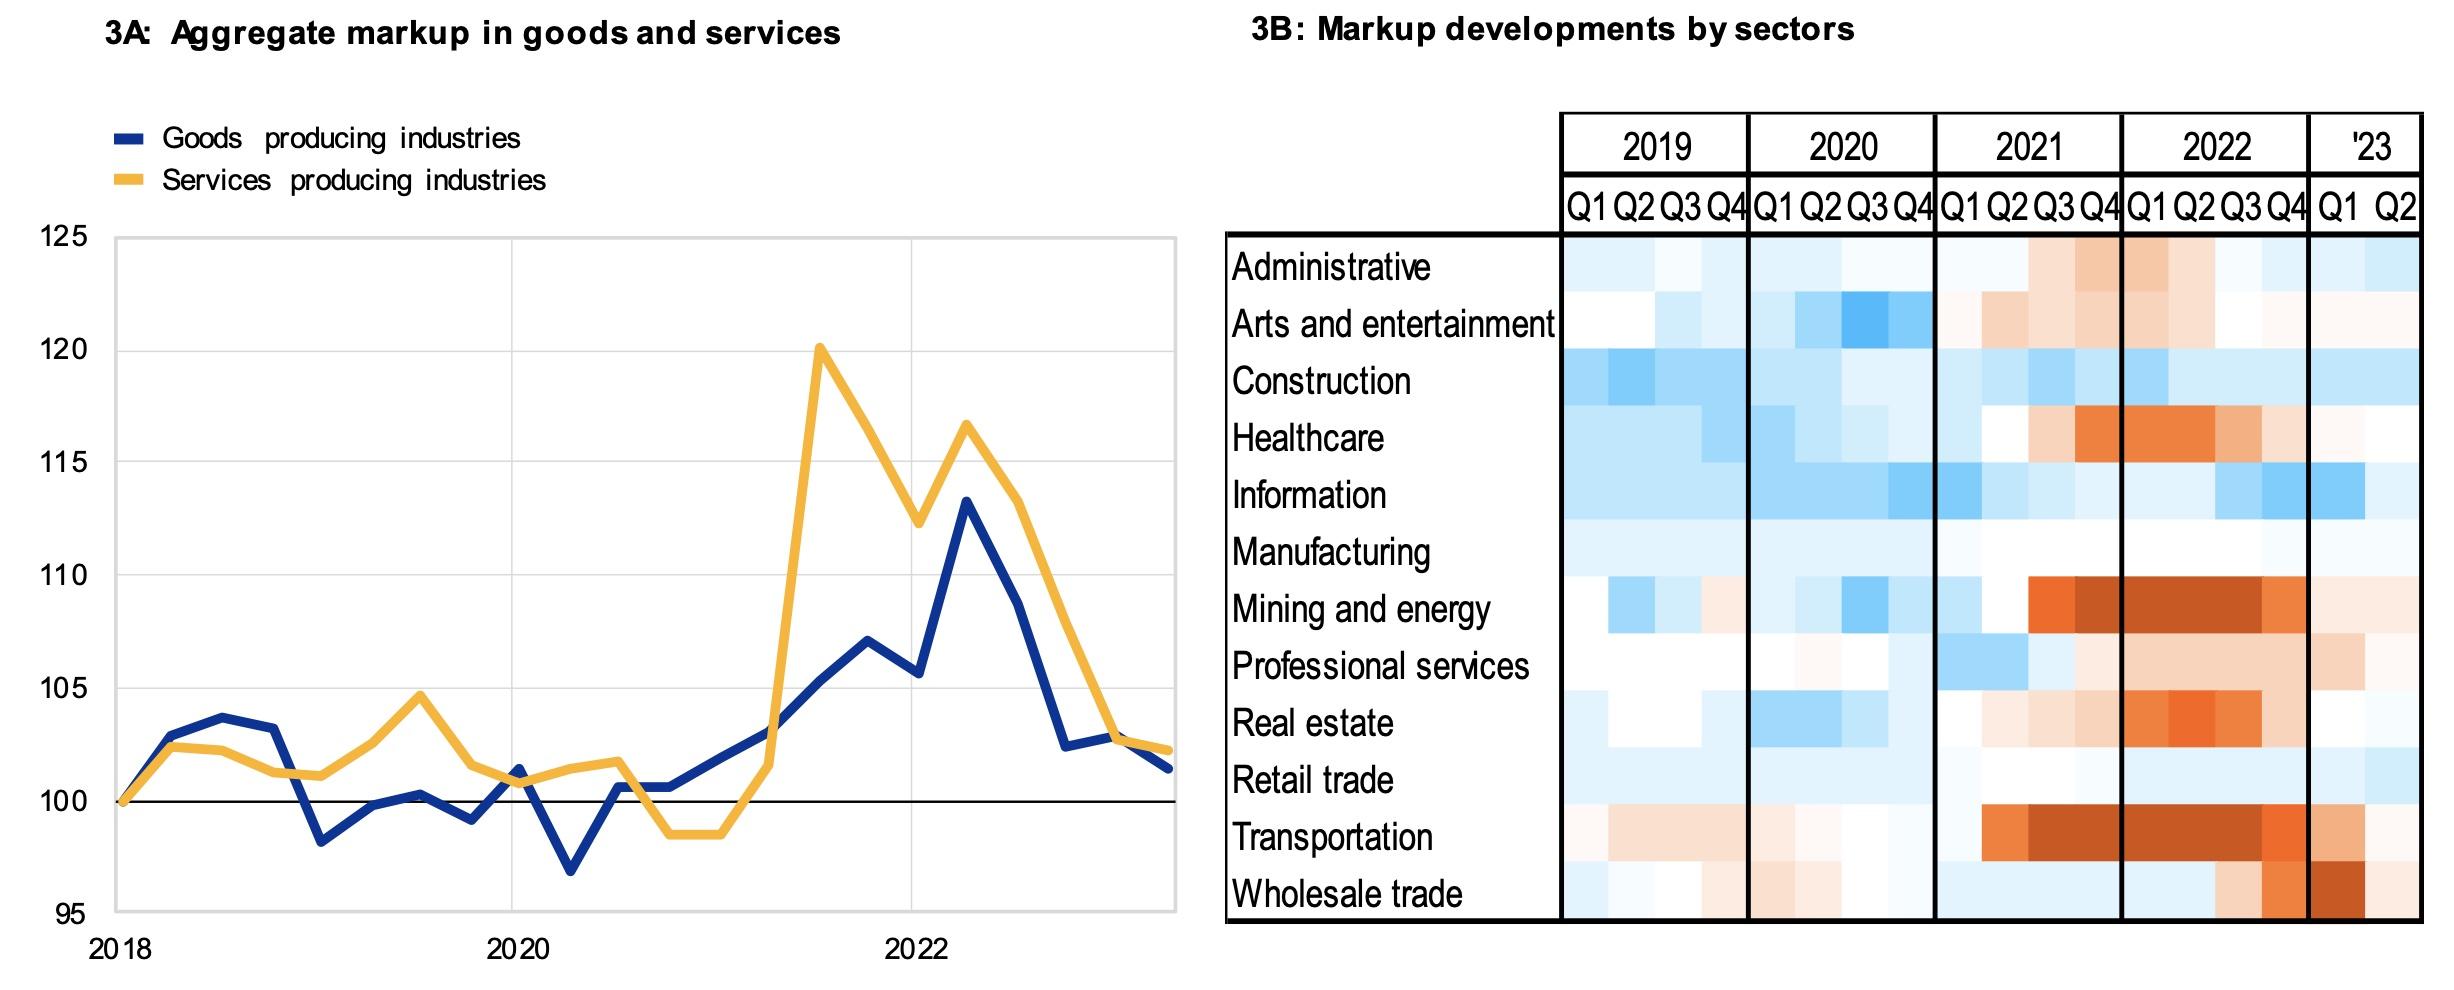
While the markup increased both for goods and services industries, more granular data show that this increase was concentrated in a few sub-sectors. Across both goods producing and services producing firms, the markup features similar dynamics (Figure 3A). In goods producing industries, the markups started to rise earlier but the increase was less steep than in the services sector. A sectoral decomposition shows that the increase was driven by a few sub-sectors, such as mining and energy, transportation, and healthcare (Figure 3B), namely those more strongly affected by both the pandemic and the Russian war on Ukraine.
Figure 3 Granular price markups (indices; 2018 Q1 = 100)
Sources: Refinitiv Financials and authors’ calculations.
Notes: For the left-hand side panel , markups are aggregated in terms of overall goods and services producing industries based on NAICS sector classification provided by the Bureau of Labour Statistics (goods; services). The aggregation is done using time-varying sales revenue weights of individual firms in each sector. For the right-hand side panel, firm-level markups are aggregated into NAICS sector markups, based on time-varying sales weights of each sector. Progressively darker red shades indicate greater percentage difference to the average markup during 2015 Q1 – 2019 Q4, whereas progressively darker blue shades indicate higher negative percentage difference. Latest observation: 2023 Q2.
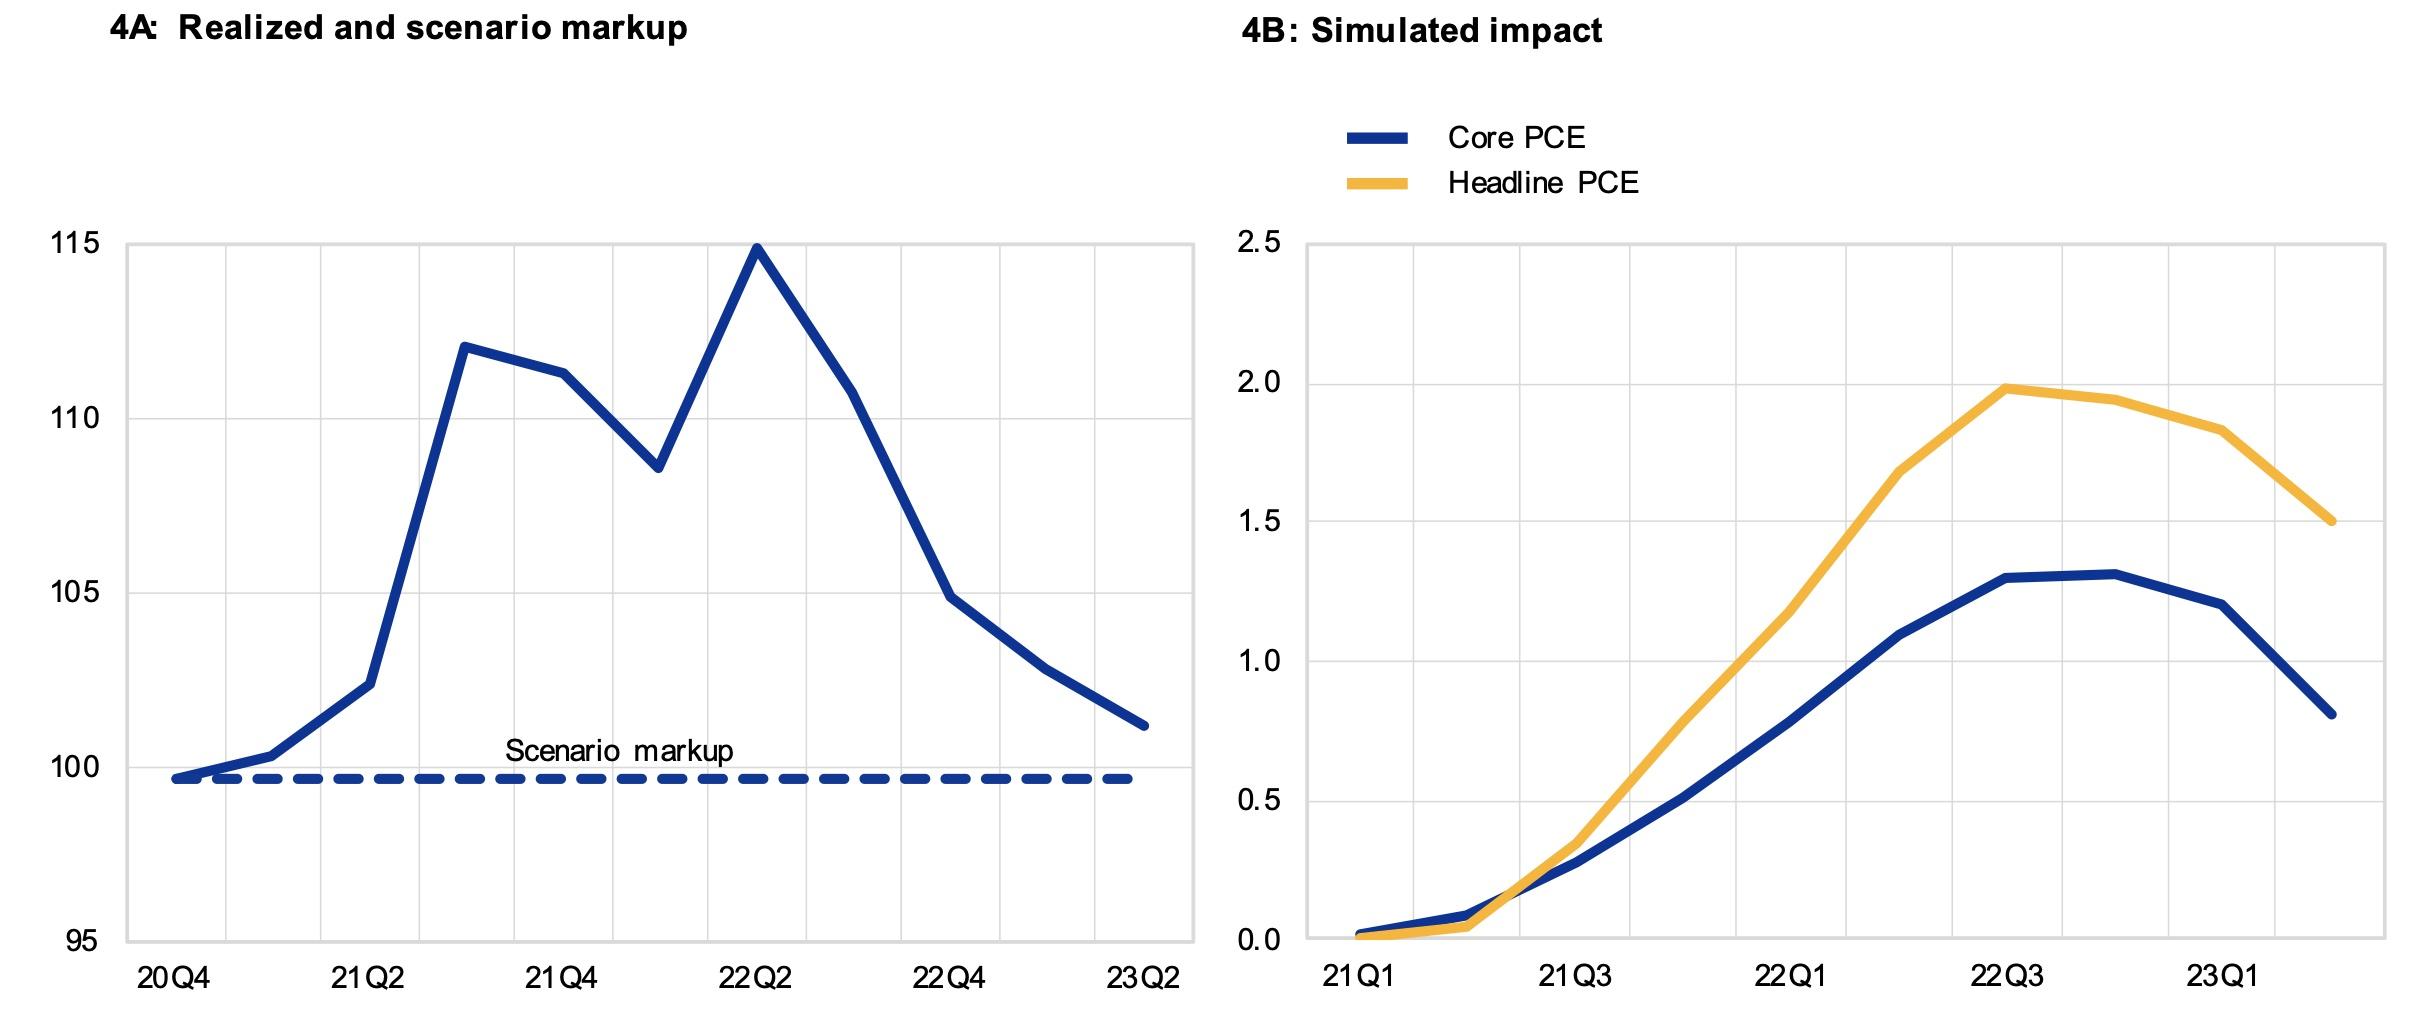
The past increase in aggregate price markups accounts to some extent for the increase in inflation in the US over the recent past. Using a Bayesian Vector Autoregression (VAR) model, we quantify the effect of a higher price markup on core and headline Personal Consumptions Expenditure (PCE) inflation using a counterfactual scenario analysis. In this scenario, we calculate impact on inflation of the actual markup increase observed over the period 2021 Q1 – 2023 Q1 by using a constant markup at 2020 Q4 level as the counterfactual (Figure 4A). Both the US headline and core PCE inflation increase significantly, albeit only temporarily in response to a higher markup. At the peak, however, headline inflation is around two percentage points above the constant markup scenario while core inflation is around 1.5 percentage points higher, accounting for around one-fourth of the observed peak headline and core inflation during the same period. Afterwards both measures gradually revert towards the baseline by early 2024 (Figure 4B).
Figure 4 Impact of higher markup on headline and core inflation (left-panel: indices, 2018 Q1 = 100; right-panel: percentage points of year-on-year growth rates)
Source: Refinitiv Financials, Haver Analytics and authors’ calculations.
Notes: The passthrough is calculated using a Bayesian VAR model with four endogenous variables (PCE headline/core inflation, GDP, short-term interest rate and real wage) and one exogenous variable (the aggregate markup). The effect on inflation is given by the difference between two conditional forecasts; one where the markup assumes the realised values and another where the markup remains constant. Both are derived over the period 2021 Q1 to 2023 Q2. Constant markup scenario is based on 2020 Q4 level of the realised markup.
In the context of the debate on profit-led inflation and greedflation, these results should be interpreted cautiously for two reasons. First, markups may have increased for other reasons than firm greediness, such as firms recouping pandemic losses or because of the uncertainty about future cost increases and menu costs. Second, the term greedflation seems semantically misleading in a market system that builds upon profit-maximising behaviour as a normal feature: if the markup increases, as consumers are willing to pay more (for the same product), then reaping this willingness resembles profit maximising behaviour – rather than greediness – possibly in response to (temporary) changes in consumer preferences.
Author’s note: The views expressed in this column reflect those of the authors and not the official position of the European Central Bank. The text was written at the time when Luca Metelli, currently at International Monetary Fund, was at the European Central Bank.
References
Arce, O, E Hahn and G Koester (2023), “How tit-for-tat inflation can make everyone poorer”, The ECB Blog, March.
Colonna, F, R Torrini and E Viviano (2023), “The profit share and firm mark-up: how to interpret them?”, Occasional Paper Series, Banca d’Italia.
De Loecker, J, J Eeckhout and G Unger (2020), “The Rise of Market Power and the Macroeconomic Implications”, Quarterly Journal of Economics 135(2).
Glover, A, J Mustre-del-Rio and J Nichols (2023), “Corporate Profits Contributed a Lot to Inflation in 2021 but Little in 2022- A pattern seen in past economic recoveries”, Federal Reserve Bank of Kansas City Bulletin, May.
Manuel, E, S Piton and I Yotzov (2023), “Profits in a time of inflation: Some insights from recent and past energy shocks in the UK”, VoxEU.org, 12 September.
Weber, I and E Wasner (2023), “Sellers’ Inflation, Profits and Conflict: Why can Large Firms Hike Prices in an Emergency?”, Economics Department Working Paper series, February.

