In 2021 and 2022, European energy prices soared for both households and firms. As a result of these price hikes, concerns were voiced that otherwise healthy firms faced with high energy prices might not be able to remain profitable (Gazzani and Ferriani 2022, Fabra et al. 2022). To avoid widespread losses and bankruptcies, policymakers instituted support packages, such as the EU-wide Market Correction Mechanism (European Commission 2022).
In the Netherlands, producer prices for natural gas approximately trebled compared to 2019, while producer prices for electricity more than doubled. As Dutch industry has traditionally been highly dependent on natural gas, concerns about corporate viability were very prominent in the Netherlands as well. As a response, a modest support package called the TEK programme (Tegemoetkoming Energiekosten) has been instituted by the Dutch government (Netherlands Ministry of Finance 2022).
In a recent paper (Soederhuizen et al. 2023), we study to what extent the profitability of Dutch firms may have suffered from the energy price shock, and how this may have differed between industries. On a macro level, there is little evidence that profitability has suffered: the overall profit rate in 2022 in the Netherlands was 42.6% of value added, the exact same rate as in the preceding year.
One reason for this apparent limited impact is that, unlike during the previous economy-wide shock to firms (the 2020 Covid-19 crisis), firms have had ample room to respond to the present energy shock. Specifically, firms have pursued energy cost reductions or savings, and have tried to pass on the cost increase to their customers.
Despite the limited impact at the macro level, the impact of the energy price hike may have been highly heterogenous between industries. To determine in which industries firms may have been most affected, we adapt a firm-level stress test that was originally developed to gauge the effects of revenue shocks related to Covid lockdowns (Schivardi and Romano 2020, Vogt and van der Wiel 2020). Instead of a revenue shock, we adjust the stress test to model the effect of a cost price shock. In what follows, we first document the actual behaviour of Dutch firms in terms of energy savings and price pass-through. These observations serve as the basis for some of the assumptions we make in the subsequent stress test.
Firms have shown a large ability to adjust
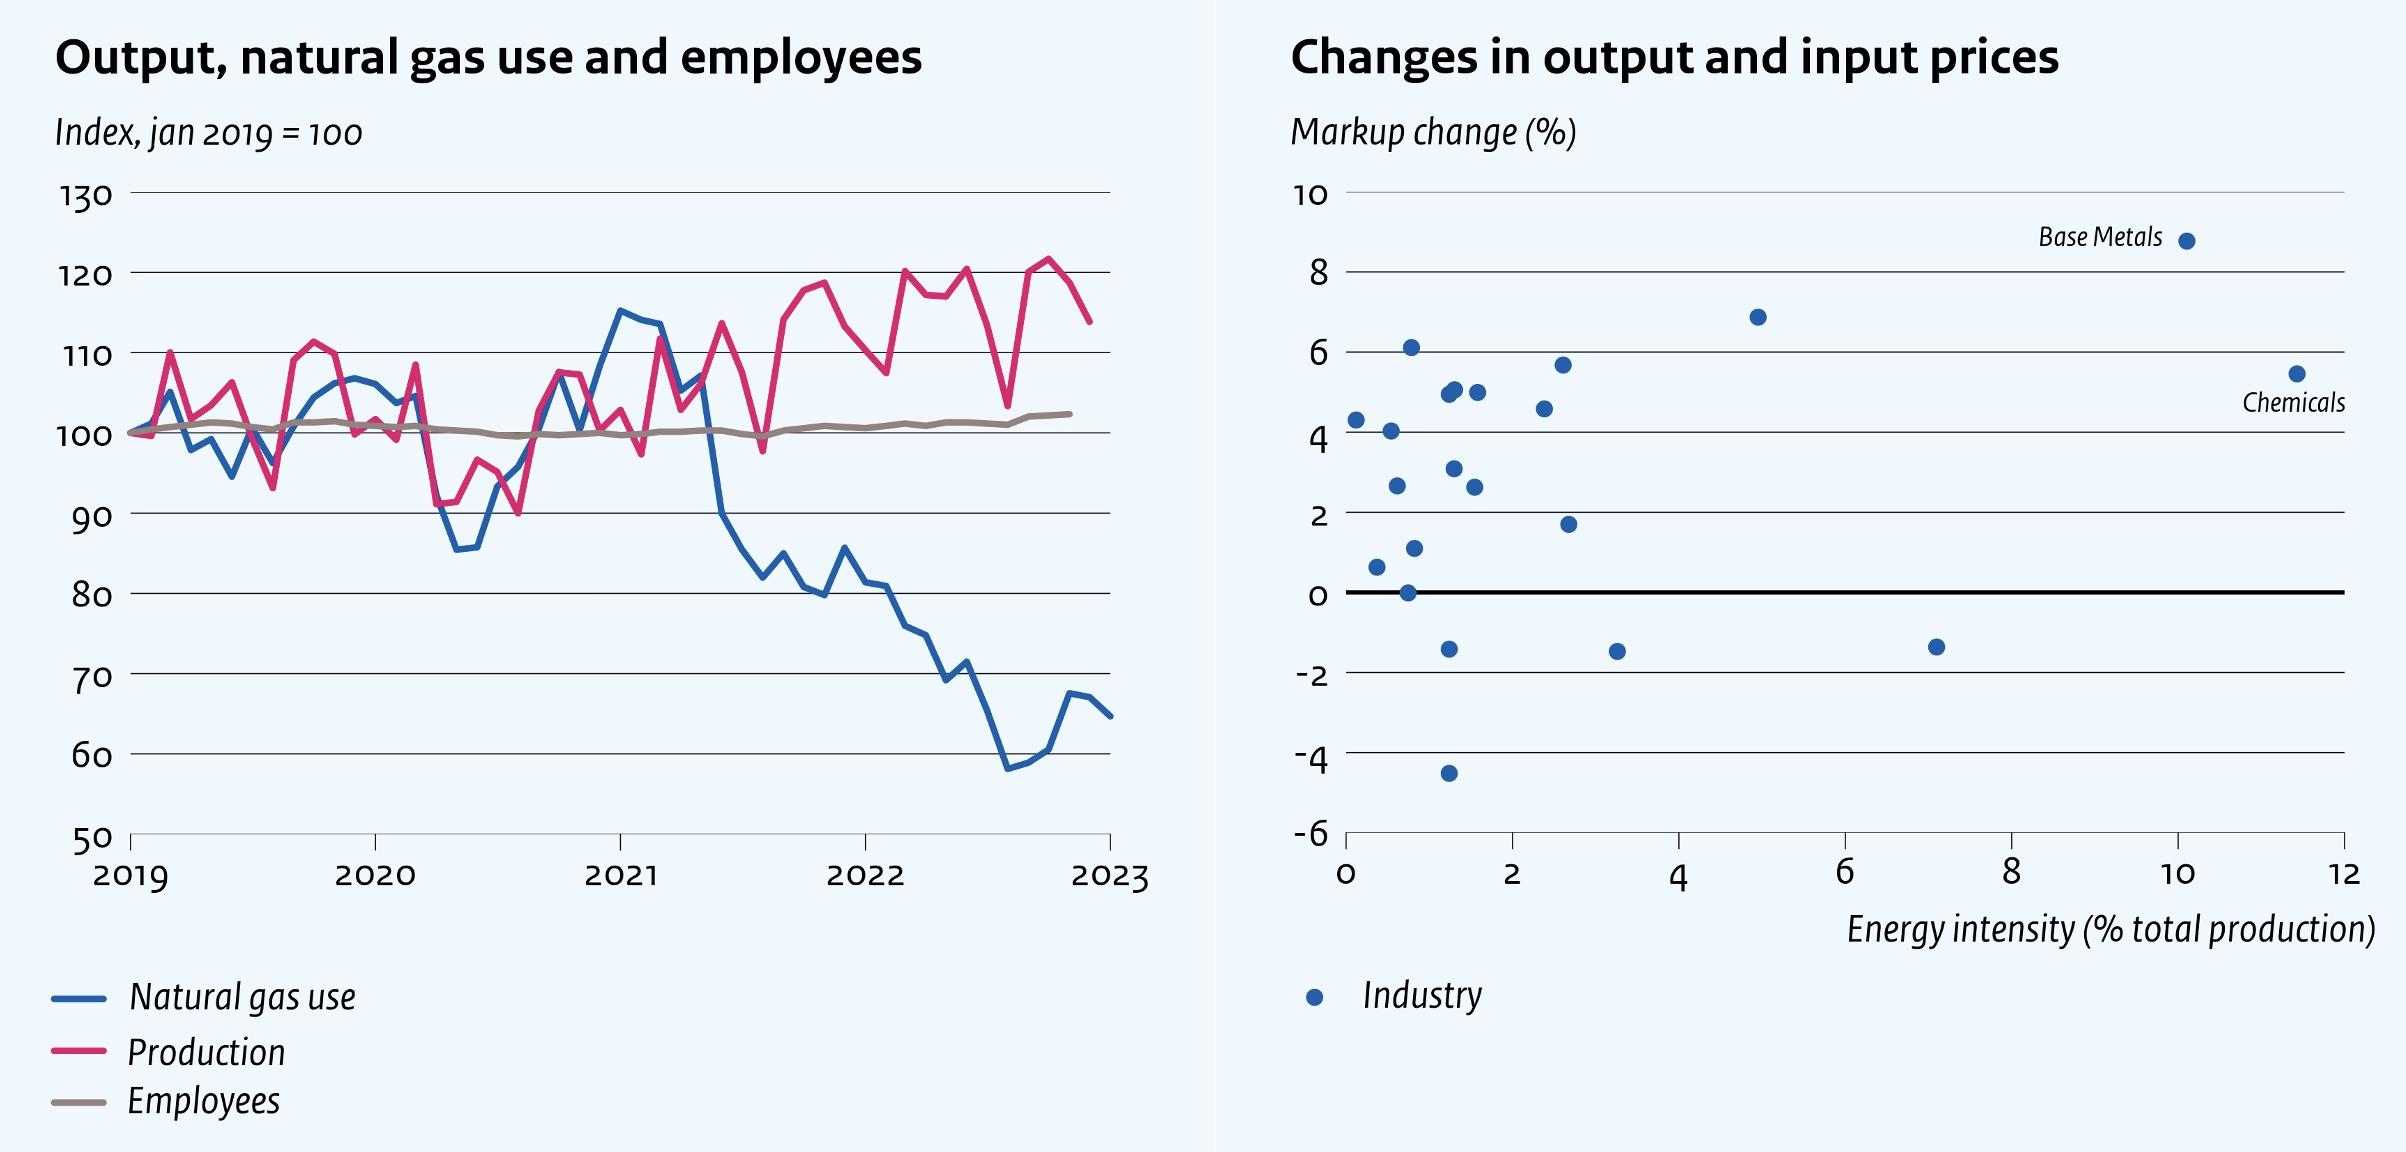
Recent data show that Dutch firms have achieved a sizeable reduction of energy use, with little loss of output. In 2022, households and businesses in the Netherlands consumed 22% less natural gas than in 2021 (27% less than in 2019), while GDP increased by 4.5% (and 5.3% since 2019). Focusing on large manufacturing firms, the left panel of Figure 1 shows that these firms managed to reduce their natural gas use by approximately 40%, with little damage to total output.
Naturally, in many cases energy savings may not have been an entirely free lunch, with firms having to substitute energy for other inputs or labour. Nevertheless, large energy savings on the part of firms have apparently been possible without heavily hurting aggregate output.
Figure 1 Firms have substantially reduced natural gas use (left) and passed on much of the price hike to customers (right)
Source: Statistics Netherlands. Calculations by the authors.
Note: In the right figure, price changes concern year-on-year changes as of November 2022. Energy intensity is defined as the total industry-level expenses on energy as a percentage of total production value in 2019. The markup change is defined as the change in the ratio of the output price and intermediate input costs.
Additionally, we document that most firms have been able to pass on much of the energy price increase to their customers. Evidence of this is presented in the right panel of Figure 1, which shows the increase of the average mark-up for manufacturing industries. A dot above the x-axis indicates that the percentage increase of the output price has been larger than the percentage increase of the weighted intermediate input price (including energy). As this figure shows, firms in most manufacturing industries have in fact raised their output prices by more than their intermediate input prices increased, pointing to at least full pass-through of the increased energy prices.
A stress test shows a limited impact on firms’ profitability
With the preceding observations in mind, we configure a firm-level stress test to determine how many firms will have suffered losses due to the increase of energy prices. We use firm-level data on the universe of limited liability corporations active in the Netherlands in 2019.
Using firms’ profit and loss statements, we simulate the effect of an increase in the prices of natural gas and electricity of 196% and 115%, respectively. These percentage increases are based on the actual price increases of gas and electricity over the 2019–2022 period. We then calculate the new profit of firms after applying the cost shock while assuming that (1) firms are able to cut back 20% of their energy use,
and (2) firms are able to pass on all of the remaining energy cost increase to their customers. We assume that demand from customers responds to this price increase with an elasticity of -1, based on Anderson et al. (1997).
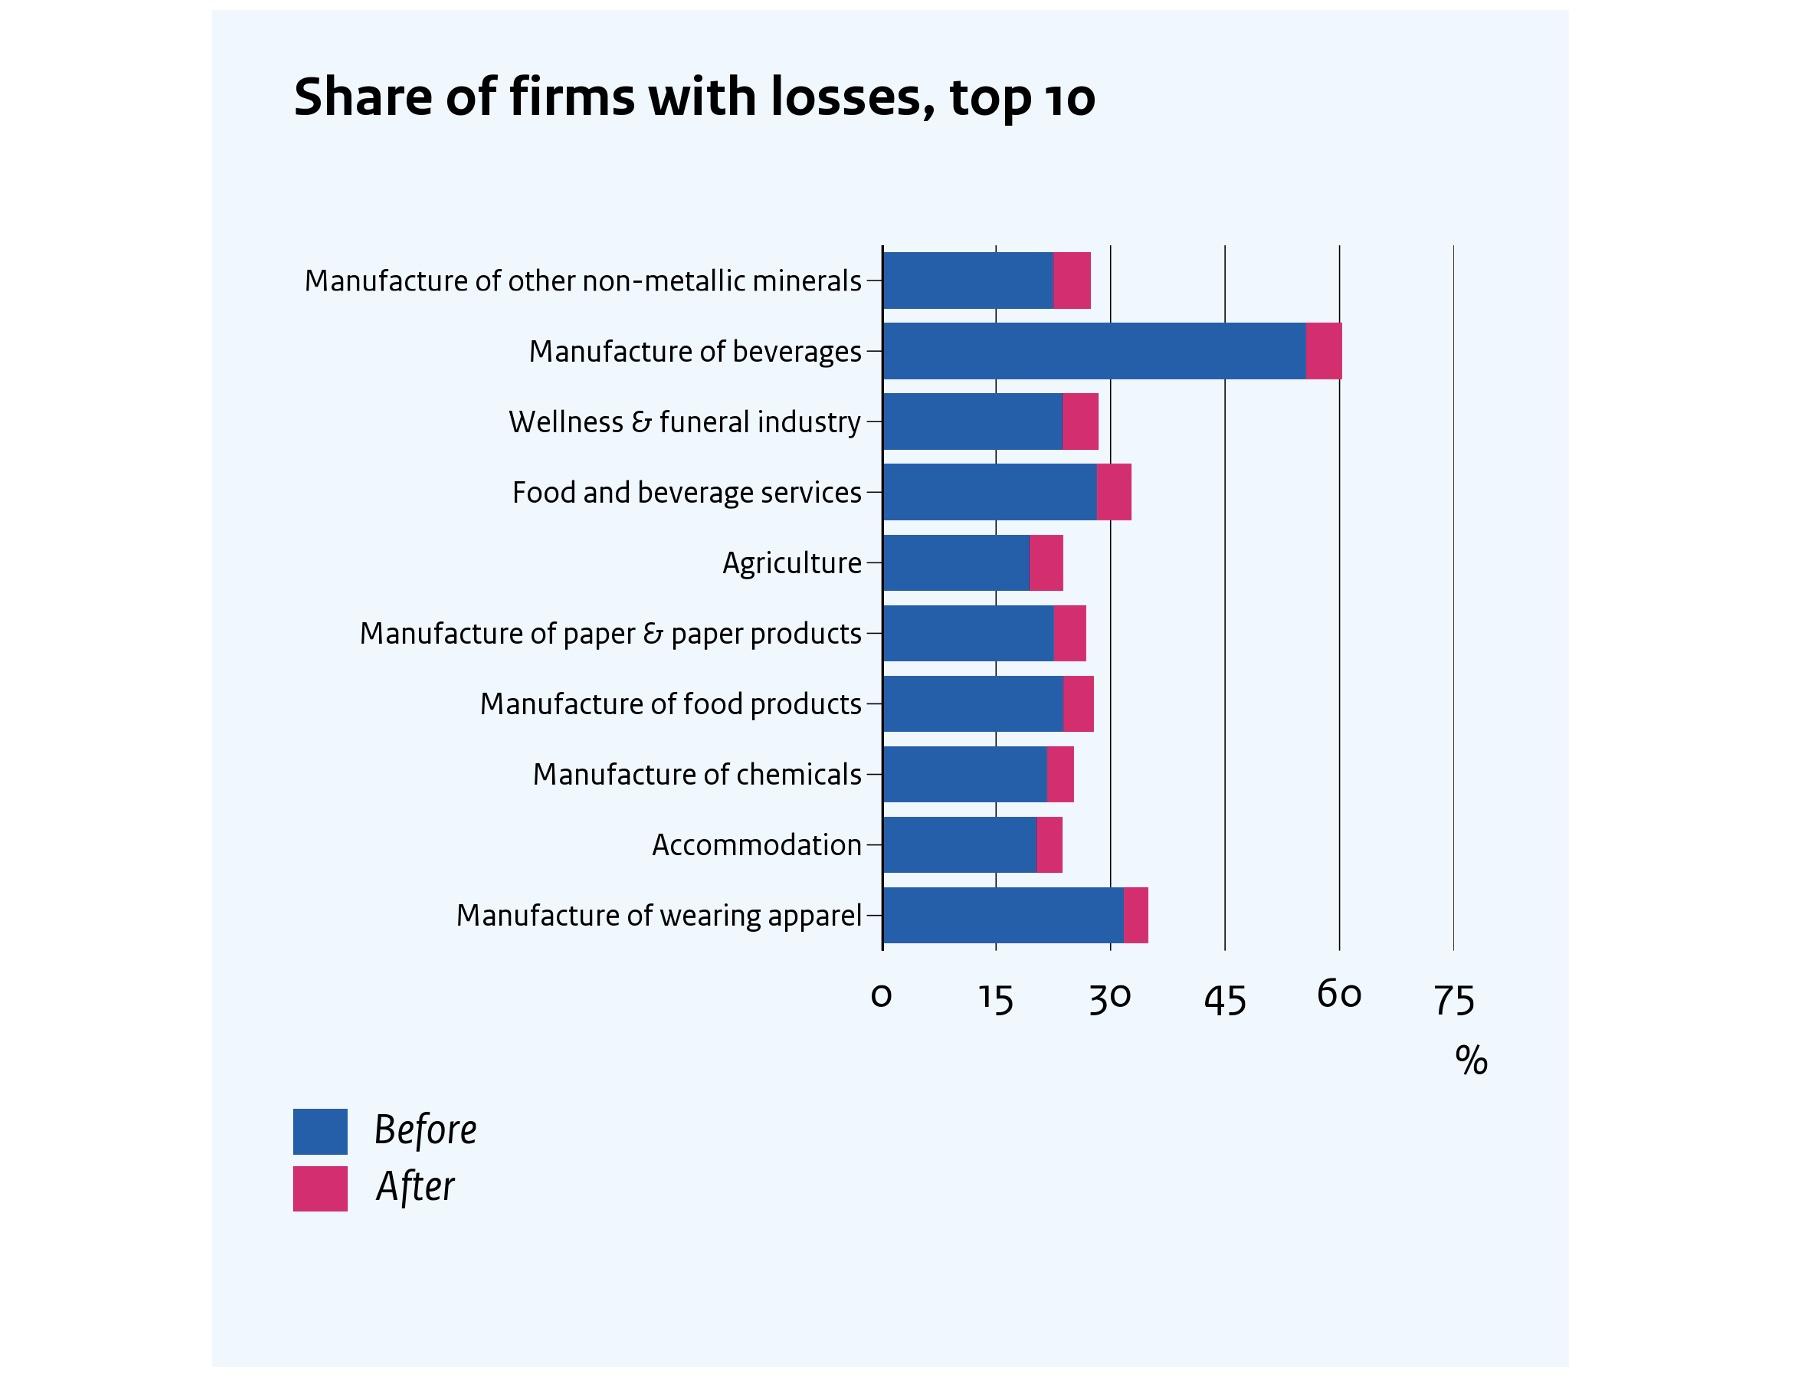
Under these assumptions, the share of firms making a loss increases by 2 percentage points after the energy price shock. In the actual data, 20% of all Dutch limited liability corporations operated at negative net profits in 2019. After applying the aforementioned energy price increases, this share increases to 22%. Out of the total of approximately 200,000 firms in our dataset, this means that approximately 3,700 additional firms become loss-making.
Figure 2 shows the percentage of loss-making firms for the ten industries in which this percentage increases the most. The largest increases are in the “Manufacture of other non-metallic minerals” (this includes glass manufacture) and “Manufacture of beverages” industries. Third-ranked is the “Wellness & funeral” industry, an admittedly rather peculiar statistical amalgam of energy-intensive services. All in all, the most energy-intensive industries are most heavily affected. Across the full population, small firms are affected somewhat more (+1.9 percentage points) than intermediate (+1.4 percentage points) and large firms (+1.0 percentage points).
Figure 2 Top ten most affected industries by percentage of loss-making firms
Source: calculations by the authors, based on firm-level data of Statistics Netherlands
One might argue that assuming costless energy savings of 20% and full pass-through of energy costs paints an overly optimistic picture of firms’ ability to adjust. We therefore study two additional scenarios with more conservative assumptions. In one of these scenarios, firms cannot adjust their inputs or prices at all in response to the energy price shock.
Even in this scenario, the share of firms making a loss increases by only 4 percentage points to 24%, although some industry-level increases are now more sizable. In an intermediate scenario, in which we assume 50% pass-through, the rise in the percentage of loss-making firms becomes 3 percentage points.
Conclusion
As our stress test shows, the impact of the energy crisis on Dutch firms’ profitability has been fairly limited. Needless to say, some individual firms may well have been hard hit by sharply increased energy prices. On an aggregate level, however, our stress test shows that the impact of the energy price shock on firms’ profitability has most likely been small. The largest effects have probably been on energy-intensive industries. One important reason why the impact has been limited overall is that firms need not passively endure a price hike – they can adjust to it. Specifically, Dutch firms have been able to decrease energy use with little damage to output, and moreover have been able to pass on much of the price hike to their customers. Our study therefore suggests that there is little need for wide-spread government support to firms in the face of increased energy prices.
References
Anderson, P L, R D McLellan, J P Overton and G L Wolfram (1997), “Price elasticity of demand”, Mackinac Center for Public Policy 13(2).
European Commission (2022), “Commission proposes a new EU instrument to limit excessive gas price spikes”, press release, 22 November.
Fabra N, K Neuhoff and N Berghmans (2022) “European economists for an EU-level gas price cap and gas saving targets”, VoxEU.org, 16 November.
Gazzani, A and F Ferriani (2022), “The impact of the war in Ukraine on energy prices: Consequences for firms’ financial performance”, VoxEU.org, 7 October.
Labandeira, X, J M Labeaga and X López-Otero (2017), “A meta-analysis on the price elasticity of energy demand”, Energy Policy 102.
Netherlands Ministry of Finance (2022), “Kamerbrief regeling Tegemoetkoming Energiekosten (TEK) voor energie intensieve mkb-bedrijven”, Letter to the Netherlands Lower House of Parliament, 14 October.
Pruijt, B and G Brouwer (2022), “Hoe raken de gestegen energiekosten het Nederlandse bedrijfsleven?”, DNB Analyse, De Nederlandsche Bank.
Schivardi F and G Romano (2020), “Liquidity crisis: Keeping firms afloat during Covid-19”, VoxEU.org, 18 July.
Soederhuizen B, L Bettendorf, A Elbourne, B Kramer, G Meijerink and B Wache (2023), “A simulation of energy prices and corporate profits”, CPB Publication, CPB Netherlands Bureau for Economic Policy Analysis (link).
Vogt, B and K van der Wiel (2020), “Een stresstest van het Nederlandse mkb”, CPB Achtergronddocument, CPB Netherlands Bureau for Economic Policy Analysis.
