The Covid-19 pandemic and rising geopolitical risks have highlighted the significance of supply chains.
Consequently, there is a pressing need for policymakers to consider the spillover effects of public policies propagated through supply chains. One such area is tax policy. The effectiveness of tax policies targeting firms is evaluated conventionally based on the effects on the firms that are directly affected by the tax policies. However, the indirect effects through the supply chains of the directly affected firms can also be of first-order importance.
One commonly practiced stimulative tax policy is a tax incentive for investment through bonus/accelerated depreciation. This policy has again recently been implemented by many countries to recover from Covid-19. The effects of this policy on the directly affected firms are rigorously examined by Zwick and Mahon (2017). Using the tax administrative data in the US, they find that a bonus depreciation tax policy significantly increases investment activities of firms (especially for small firms). However, no study has yet examined the spillovers of this policy through production networks, so my recent study, Koizumi (2024), addresses that gap. This study investigates a bonus depreciation tax policy introduced in 1998 that has continued since then in Japan, which targeted small and medium-sized enterprises (SMEs). My study exploits a unique proprietary dataset provided by Teikoku Data Bank (TDB) that covers sales information from approximately half a million firms and reports the presence of firm-to-firm transactions for these firms in the period 1993-2003. Using the policy shock and the unique dataset, the study provides two noteworthy findings: (1) while significant upstream propagation was found, no discernible effects were detected on downstream firms, and (2) targeting SMEs may, paradoxically, primarily benefit large firms through the supply chain.
Before delving into the details of the findings, let us review how bonus depreciation works to stimulate investment. Bonus depreciation allows companies to realise tax savings based on the nature and amount of equipment purchased. For instance, when a company invests in durable equipment like machinery or vehicles, the conventional accounting approach involves recording the cost as ‘depreciation’ over time. Bonus depreciation allows SMEs to deduct an additional percentage value of capital expenditures in the first year of an asset’s tax life. Note that this policy does not increase the total depreciation amounts and thus simply accelerates deductions from further in the future. However, it frees up funds for companies with liquidity constraints, enabling them to diversify investments or expand production.
Now, let us consider spillovers. A company buying the equipment generally increases production and thus increases raw material purchases, leading to heightened demand for supplier firms. The sudden surge in sales could cause shortages and price hikes, triggering upstream propagation. Meanwhile, to sell more, the company purchasing the equipment usually needs to decrease the price of their products. If many firms in the same market also purchase equipment induced by the tax policy, this would benefit the downstream firms through decreased price levels of their inputs. My study empirically tests this theoretical prediction.
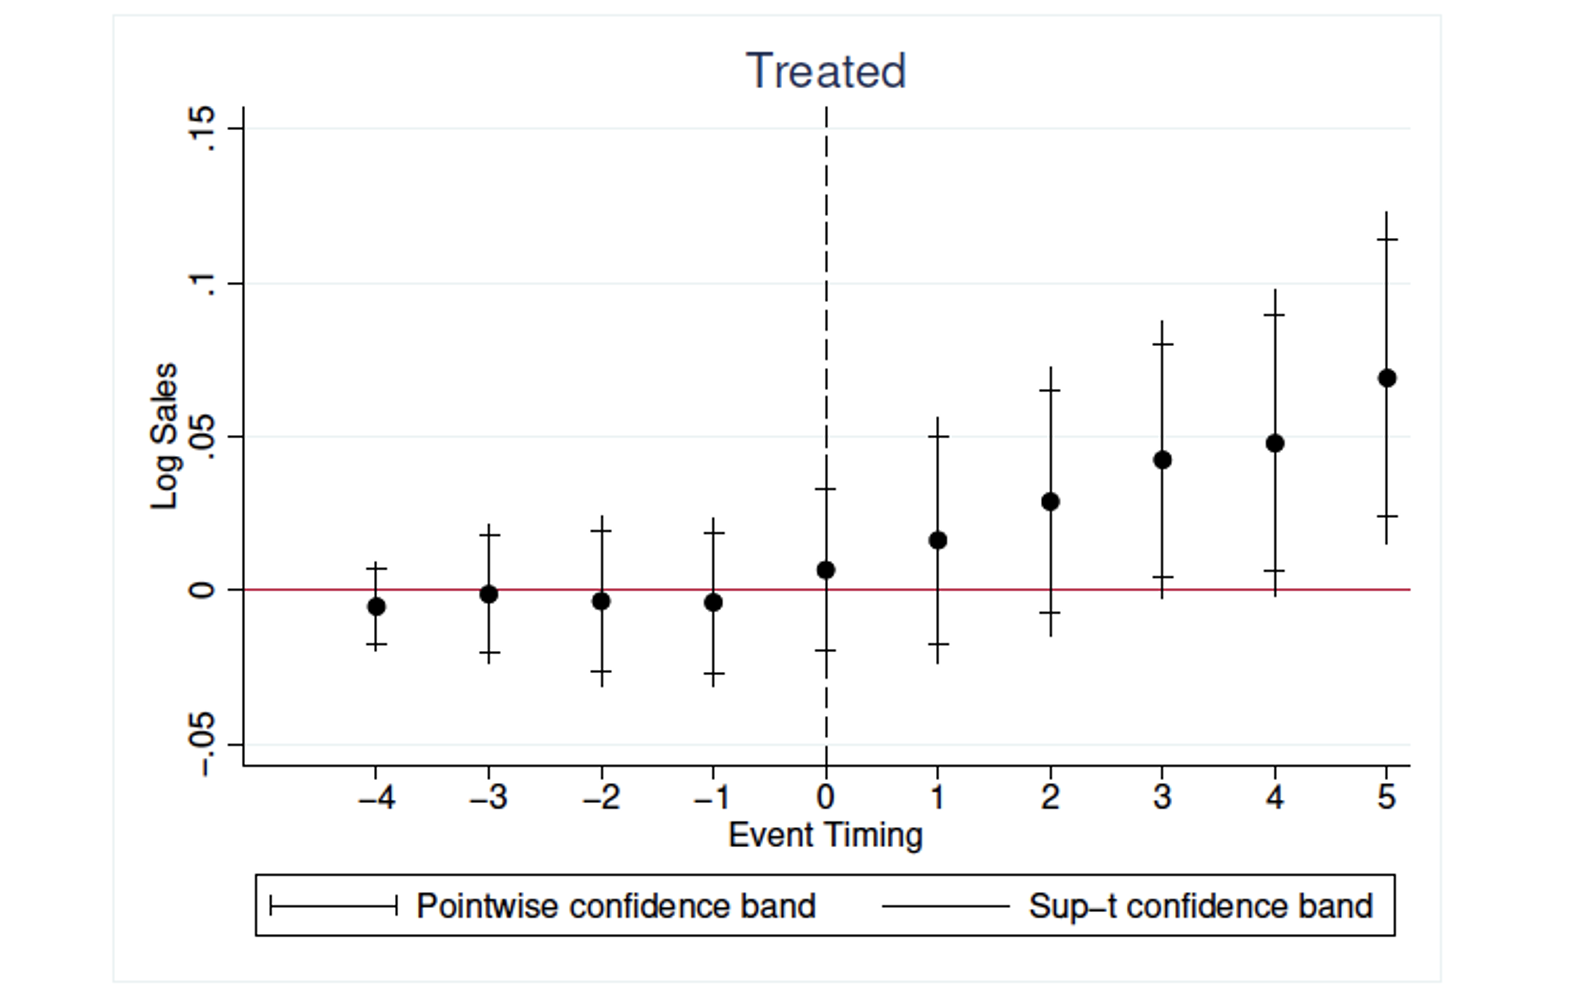
First, my study demonstrates the direct effects of the tax policy as depicted by Figure 1. The horizontal axis indicates the time period where 0 is equal to FY1998 that corresponds to the year the policy took effect, -1 means FY 1997, and so forth. The vertical axis is the natural logarithm of the sales value. Roughly speaking, each dot indicates the percentage difference in sales between the directly affected firms and the comparison group. You can see that the difference increases substantially after the policy shock.
Figure 1 Direct effects
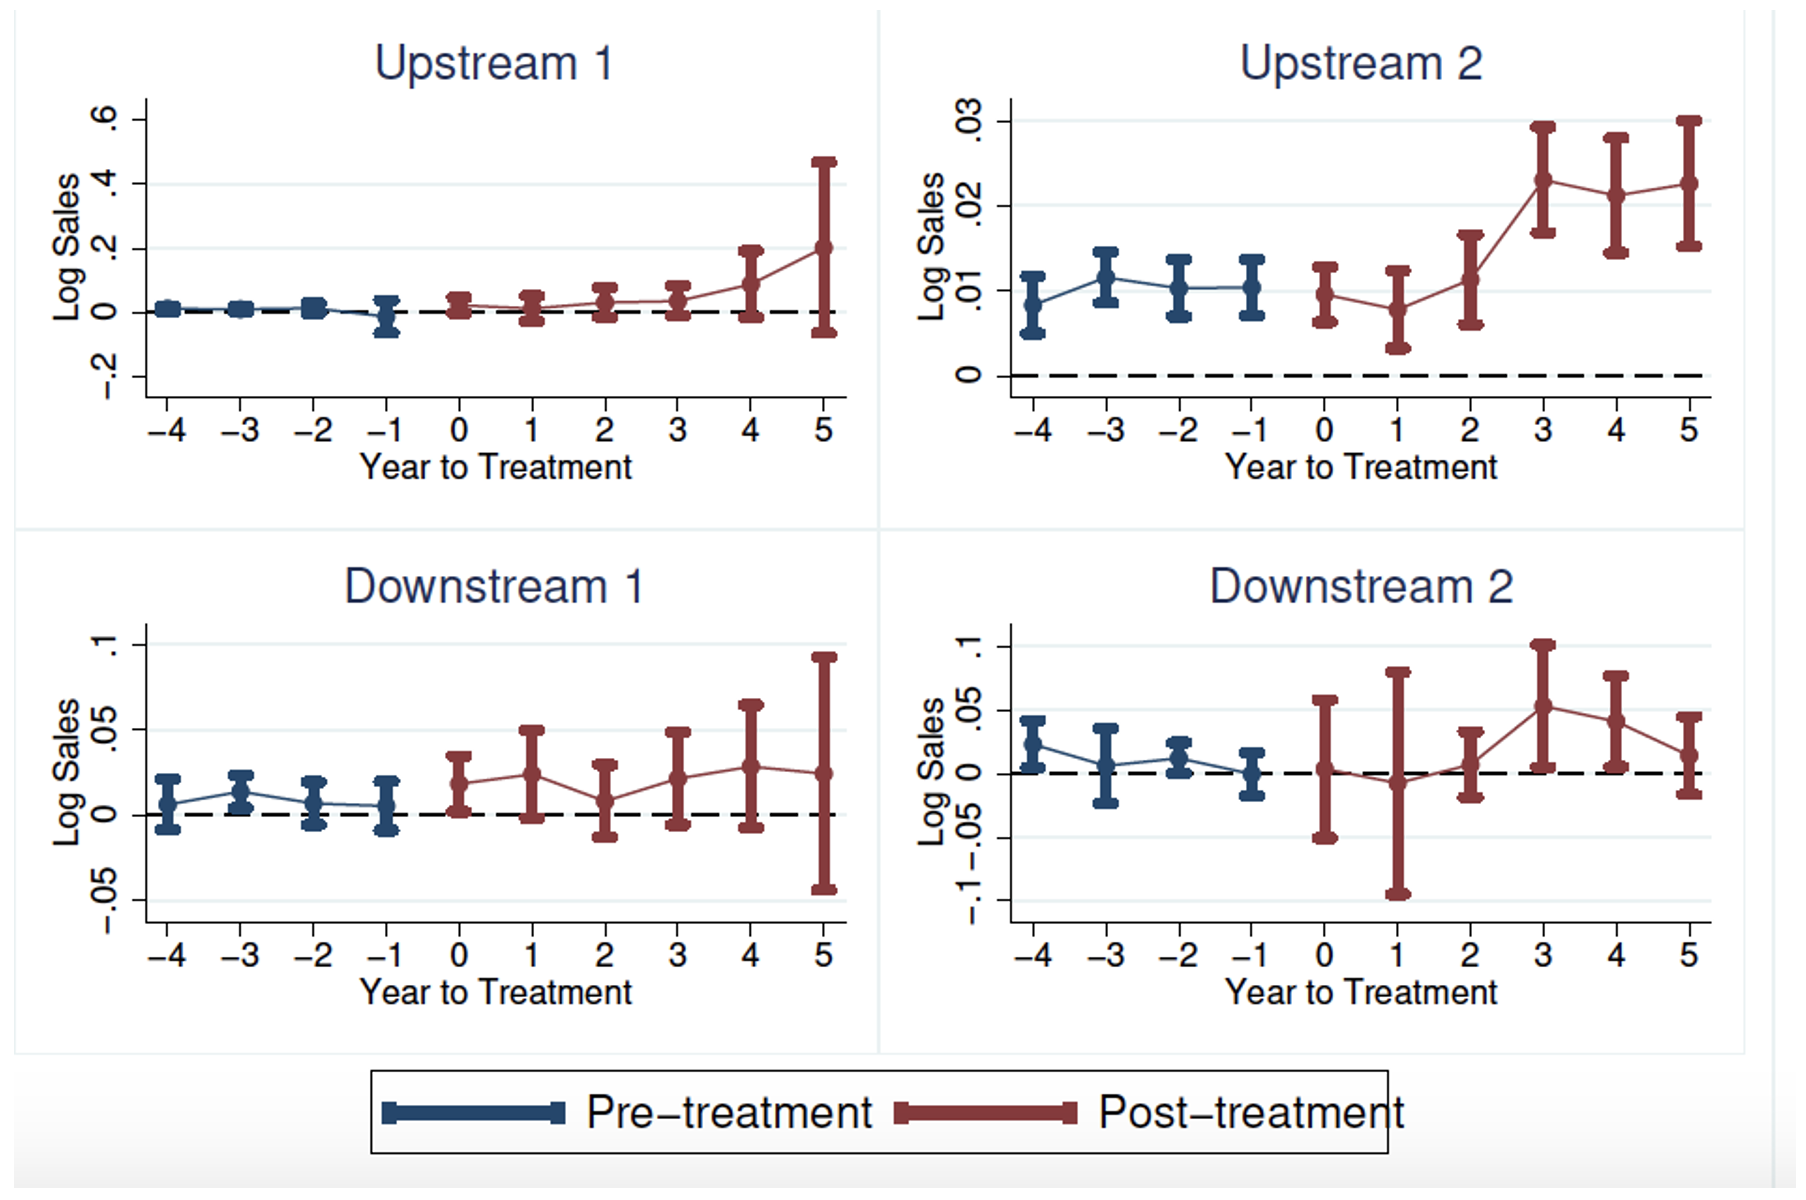
Next, as Figure 2 below indicates, there is a heterogeneity in the spillover patterns. Upstream 1 indicates the sample of the direct suppliers of the directly affected firms, and Upstream 2 is that of the suppliers of the direct suppliers, while Downstream 1 is that of the direct customers, and so forth. Although my study refrains from inference over Upstream 2 firms due to the violation of a statistical premise, the other panels indicate that Upstream 1 firms experience a large increase in sales over time, and downstream firms do not. Interestingly, the estimated effects on the direct customers turn out to be of even larger magnitude than the direct effects.
Figure 2 Indirect effects
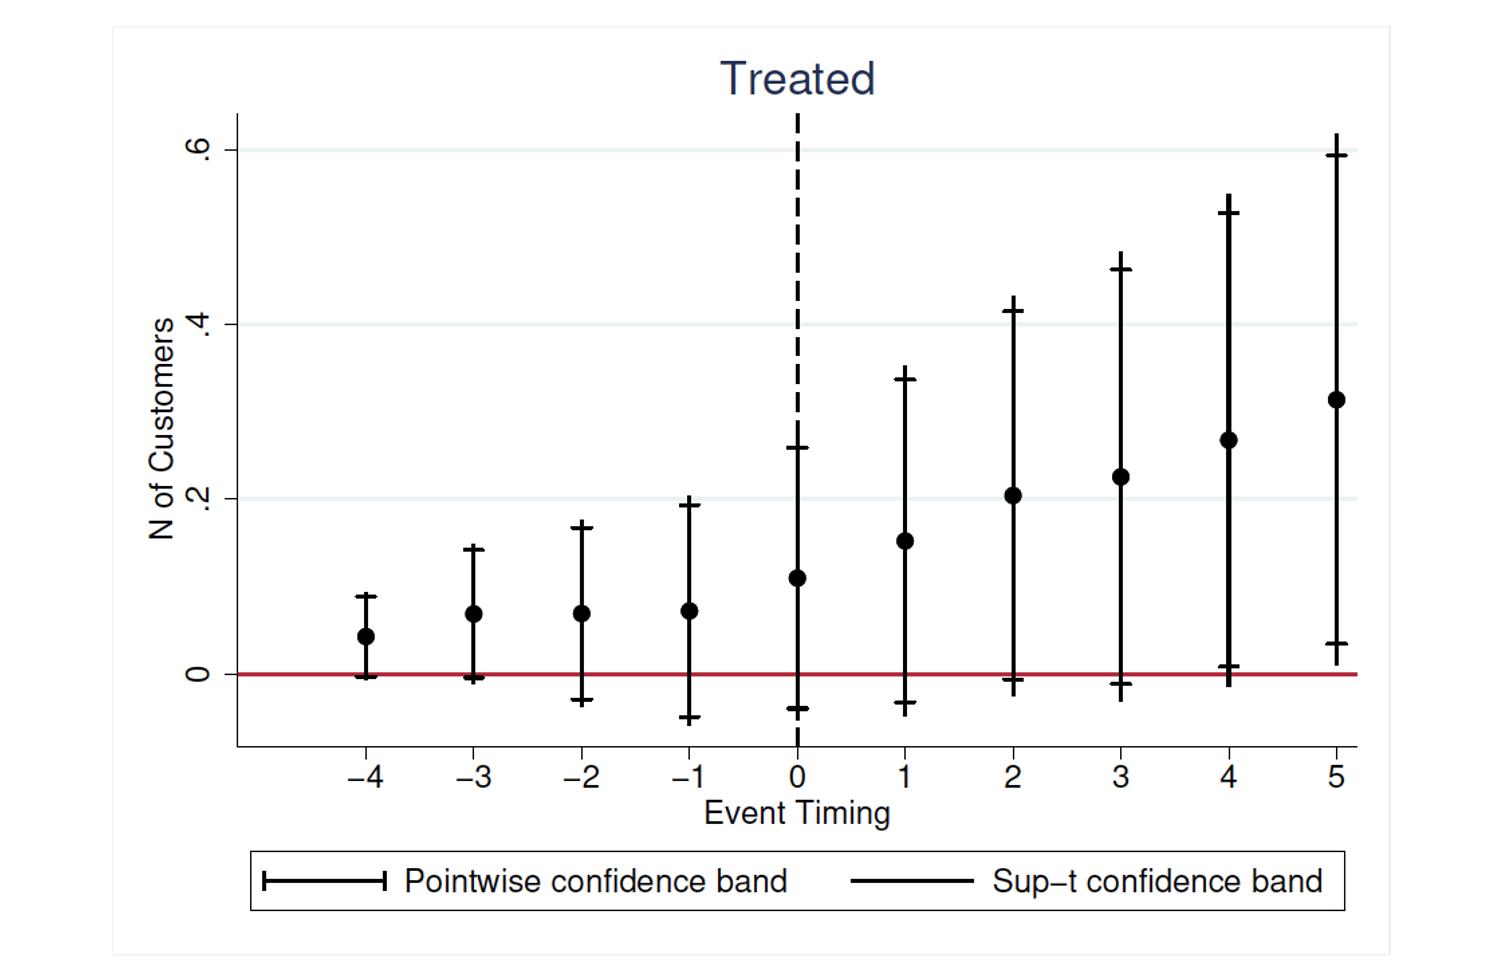
As for the absence of impact on customer firms, I find suggestive evidence that the policy induced SMEs to crowd out the market share of non-SMEs. Although the dataset in my study unfortunately does not have transaction amounts for most of the firms, as Figure 3 shows, the directly affected SMEs have increased customer numbers after the policy, implying the crowding out. Since the tax incentive excludes support for medium and large firms selling similar products, overall market output might have not witnessed significant growth. This nuanced understanding reveals that downstream price reduction effects are insufficient to establish a statistically significant impact.
Figure 3 Direct effects on the number of direct customers
While there are multiple possible mechanisms for explaining why the direct suppliers benefited the most from the policy, I find a market power difference to be the most compelling story. The direct suppliers in my sample consist of many non-SMEs. These companies tend to be large and possess market power – i.e. the ability to set prices that are advantageous to them. This amplifies the indirect benefit from the policy, leading to upstream propagation that is even larger than the direct effects.
These findings suggest a need for policymakers to consider spillovers through supply chains when formulating policies targeting specific firm categories, like SMEs. In his price theory lectures, Kevin Murphy from the University of Chicago Booth School of Business explains the importance of considering policy effects on the markets for substitutes and complements when implementing policies that affect particular products. Similarly, this study suggests that policymakers need to consider supply chain spillover effects while formulating policies targeting specific sizes of firms.
Authors’ note: This column does not necessarily reflect the view of RIETI. The author is grateful to Teikoku Data Bank (TDB) and the TDB Center for Advanced Empirical Research on Enterprise and Economy, Graduate School of Economics, Hitotsubashi University (TDB-CAREE) for the provision of data sets. The cited author’s work is part of TDB-CAREE projects.
References
Baldwin, R and R Freeman (2022), "Risks and Global Supply Chains: What We Know and What We Need to Know", Annual Review of Economics 14(1).
Koizumi, H (2024), "Cascades of Tax Policy through Production Networks: Evidence from Japan", Research Institute of Economy, Trade and Industry (RIETI) Discussion Paper 24025.
Zwick, E and J Mahon (2017), "Tax Policy and Heterogeneous Investment Behavior", American Economic Review 107(1): 217-48.


